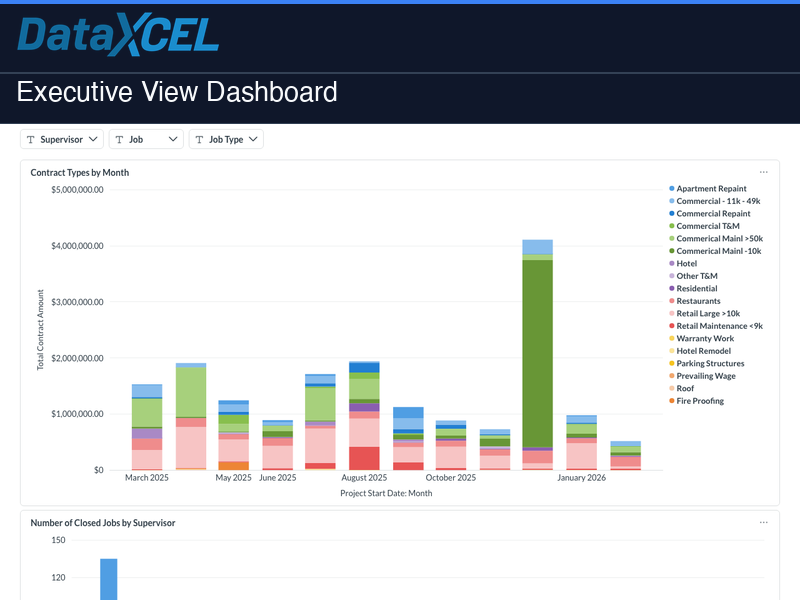
Executive View Dashboard
Owners' daily pulse — cash, AR, top jobs, change orders on one page. No Sage login needed.
$125 one-time
Pick the dashboards you need or take the full subscription. Every report below is live on the DataXcel platform — buy à la carte or grab Get It All.
Prices verified 2026-05-12 from the DataXcel shop. Cancel anytime.
One user, full data warehouse access, and the report builder. Browse the library of pre-built construction dashboards à la carte.
The full DataXcel platform: every pre-built dashboard, the 1,000+ canned report library, and a monthly AI-written board report. One flat subscription for the whole team.
Everyone gets the 50+ pre-built dashboards on day 1. Tier picks how many hours of hand-built custom dev are included in your monthly subscription. Hold a seat with a $500 refundable deposit →
The pitch for migrating to Intacct usually starts with "better reporting." DataXcel is built for Sage 100 Contractor and delivers that reporting for a fraction of an Intacct migration's first-year cost — without the rip-and-replace.
| Year-1 cost line | Sage Intacct Construction Industry-typical mid-market deploy | DataXcel — Get It All On top of your Sage 100 |
|---|---|---|
| Software licenses (5 users) | ~$18,000 – $30,000 / yr | $0 (included) |
| Implementation & data migration | ~$25,000 – $80,000 one-time | $2,500 one-time setup |
| Construction module / add-ons | $8,000 – $20,000 / yr | $0 (built in) |
| DataXcel subscription | n/a | $499 / mo — $5,988 / yr |
| Time to first dashboard | 6 – 12 months | 3 days |
| Keep your Sage 100 history? | No — migrate or archive | Yes — read-only, untouched |
| Year-1 total (rough) | $51,000 – $130,000+ | $8,488 |
Already running DataXcel Core? Add only the reports you need. Each one is a separate product on the shop.
Owners' daily pulse — cash, AR, top jobs, change orders on one page. No Sage login needed.
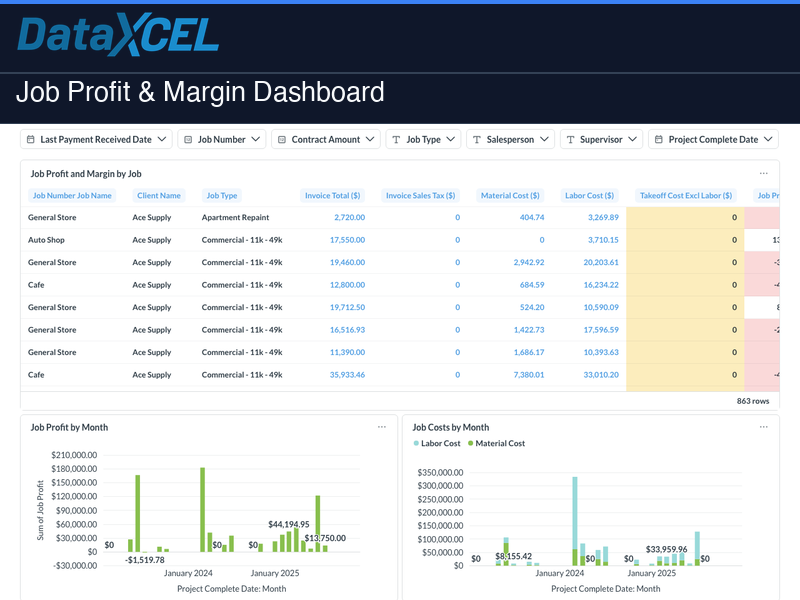
Ranks every job by profitability and drills into the cost categories driving variance.
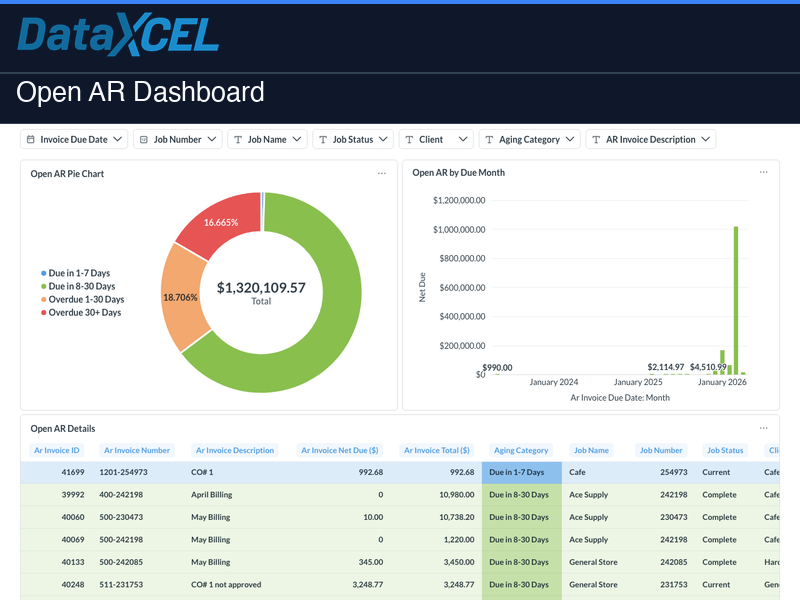
Every open invoice, who owes what, and how long it's been outstanding — with customer and job drilldown.
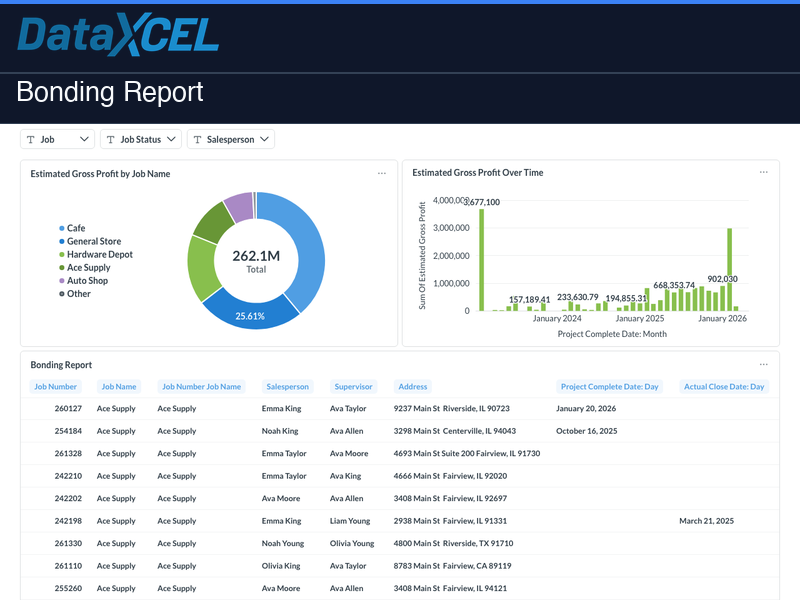
Surety-ready bonding report driven straight from your Sage data. Filterable by job and status.
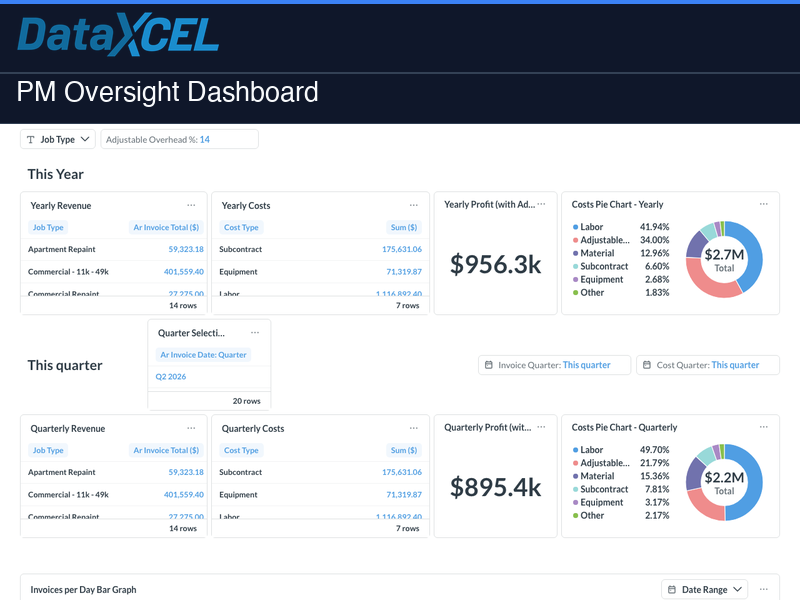
Per-PM yearly and quarterly revenue, cost, and profit with adjustable overhead and a US map of job sites.
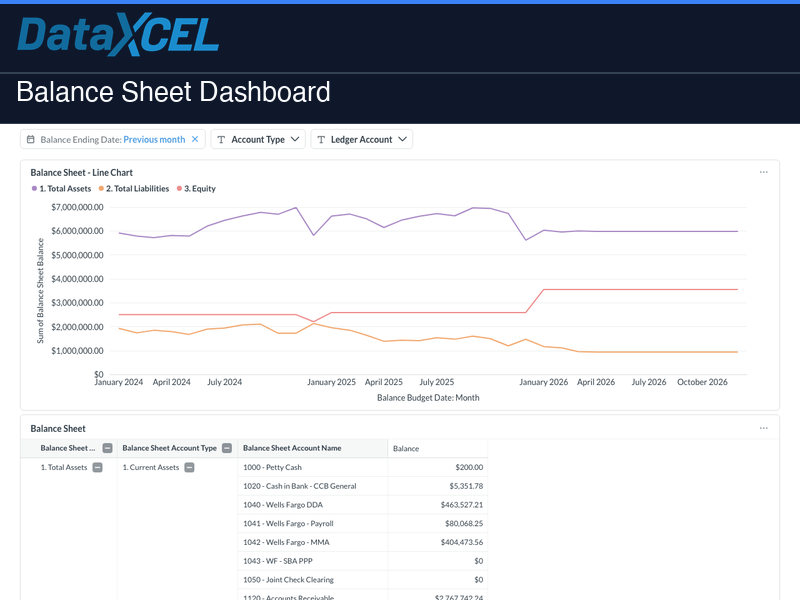
Real-time assets, liabilities, and equity from your Sage GL with prior-period comparison.
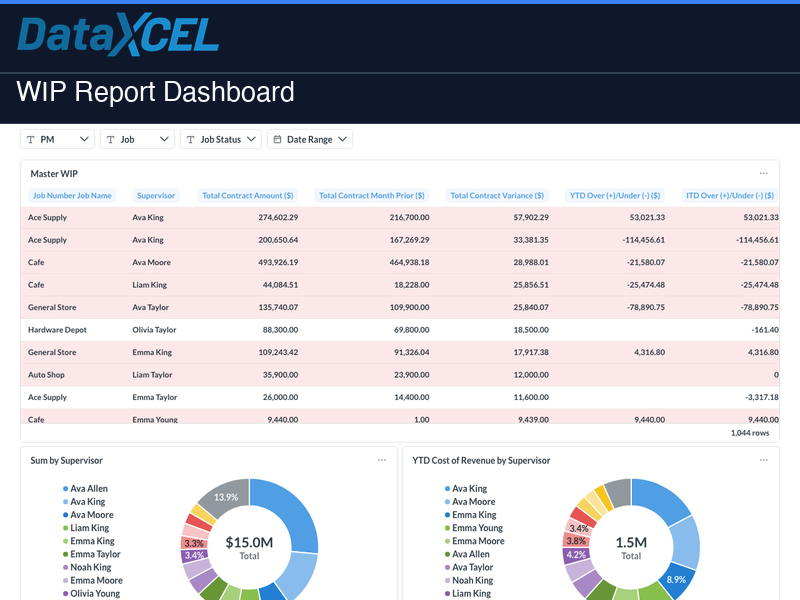
Earned revenue, billings, and over/under for every active job, plus margin performance and pipeline.
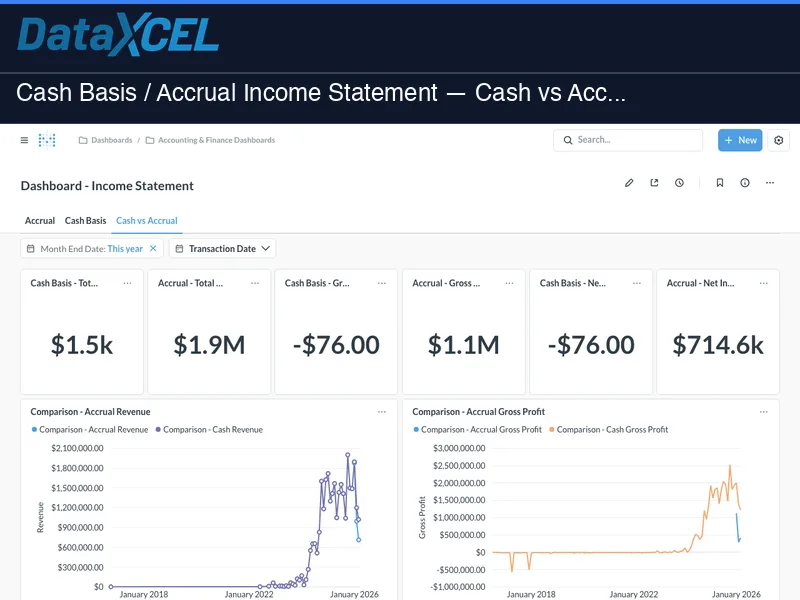
Flip your P&L between cash and accrual on the fly — month, quarter, and YTD with prior-period comparisons.
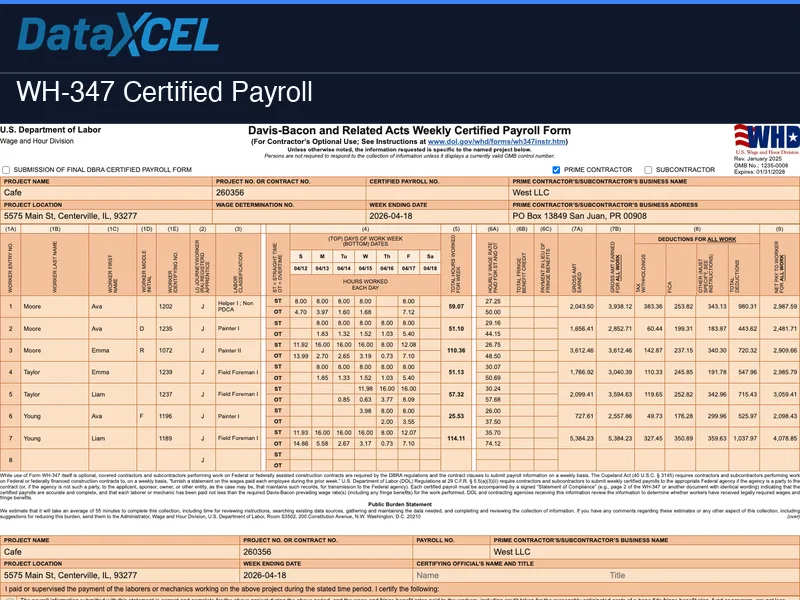
One-click Davis-Bacon certified payroll — the exact WH-347 form, pulled straight from your Sage employee, trade-class, rate, and hours data.
Most contractors start with the Executive View or WIP Report and add more as their team gets comfortable with the data. Want a walk-through?