Complete payroll visibility from your Sage data
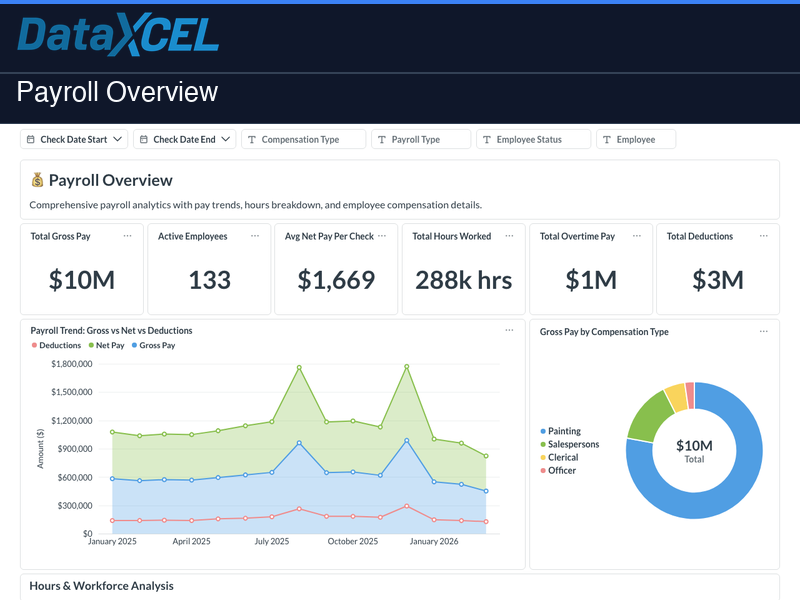
The Payroll Overview dashboard gives owners, controllers, and HR teams a comprehensive view of payroll spend, workforce composition, and compensation trends — all live from Sage 100 Contractor. Stop exporting payroll registers to Excel and start making workforce decisions with real-time data.
What’s included (17 cards)
- Total Gross Pay — company-wide gross payroll for the selected period
- Active Employees — current headcount of active employees
- Average Net Pay — mean net pay per employee per period
- Total Hours & Overtime — total hours worked and overtime hours with trend indicators
- Total Deductions — aggregate deduction amounts across all employees
- Payroll Trend — gross pay over time line chart showing seasonal and growth patterns
- Gross Pay by Compensation Type — breakdown by salary, hourly, bonus, and other categories
- Hours Breakdown — regular vs. overtime hours distribution
- Headcount Trend — active employee count over time to track hiring and attrition
- Gross Pay by Position — payroll cost ranked by job title or position
- Employee Status Distribution — active, terminated, and leave status breakdown
- Pay by Payroll Type — split by payroll type (regular, supplemental, etc.)
- Top Earners — ranked list of highest-paid employees for the period
- Overtime Analysis — overtime hours and cost by employee and department
- Payroll Calculations Summary — detailed payroll calculation breakdown table
- Payroll Pivot Table — fully drillable pivot for custom payroll analysis
6 interactive filters
Check Date Start • Check Date End • Compensation Type • Payroll Type • Employee Status • Employee
Who it’s for
- Owners monitoring total labor cost and headcount trends
- Controllers reconciling payroll runs and deductions
- HR teams tracking overtime, compensation mix, and employee status
- Project managers analyzing labor cost by position and department
⚠️ Requires a DataXcel Subscription — choose the plan that fits your team:
Explorer — $200/mo
1 user • data warehouse access • buy reports à la carte • 3 training sessions
View Explorer →Get It All — $799/mo
20 users • all 61 dashboards ($17,580 value) included • unlimited access
View Get It All →Both plans require a one-time $2,500 onboarding & setup fee.
📊 Try it live — no login required
Explore a live demo of this dashboard using real sample data. Filters, charts, and drilldowns all work — no account needed.
🔗 Open Live Demo →