What’s included
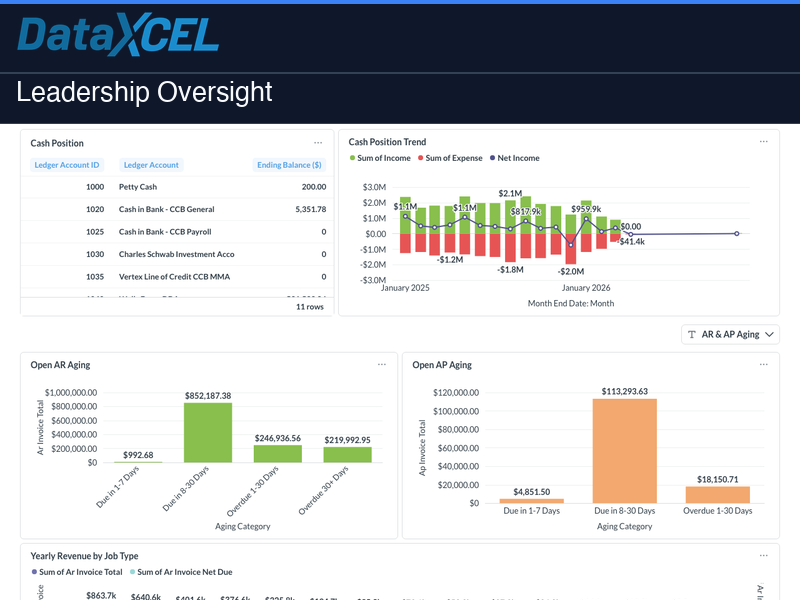
- Cash Position Trend
- Quarterly Revenue by Job Type
- Yearly Revenue by Job Type
- Open AP Aging
- Open AR Aging
- Profit and Cost
- Cash Position
- Net Fixed Assets to Stockholders Equity
Interactive filters
AR & AP Aging, Job Type, Job Status, Balance Budget Date, Selected Quarter, Comparison Quarter
Who it’s for
- Construction company owners and controllers
- Project managers tracking job performance
- Finance teams needing live Sage 100 data
⚠️ Requires a DataXcel Subscription — choose the plan that fits your team:
Explorer — $200/mo
1 user • data warehouse access • buy reports à la carte • 3 training sessions
View Explorer →Get It All — $799/mo
20 users • all 61 dashboards ($17,580 value) included • unlimited access
View Get It All →Both plans require a one-time $2,500 onboarding & setup fee.
📊 Try it live — no login required
Explore a live demo of this dashboard using real sample data. Filters, charts, and drilldowns all work — no account needed.
🔗 Open Live Demo →